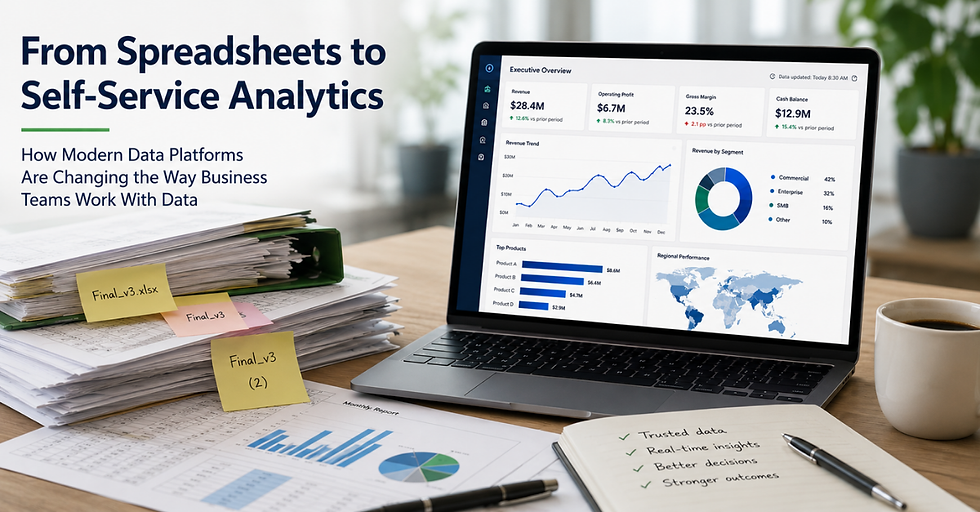
From Spreadsheets to Self-Service Analytics: How Modern Data Platforms Are Changing the Way Business Teams Work With Data
- May 26
- 7 min read
Updated: Jun 2
The Spreadsheet Remains Dominant — and That Is Part of the Problem
Spreadsheets are not going away. Around 67% of global businesses use spreadsheet software daily, and 54% rely on them for reporting and analytics. Around 58% of organisations describe spreadsheets as essential for financial planning. By measure of adoption, the spreadsheet is one of the most successful business tools ever created.
The problem is not that organisations use spreadsheets. The problem is what happens to data accuracy, reporting consistency, and decision-making quality when spreadsheets are used as the primary layer through which business-critical information is accessed, transformed, and distributed — at a scale they were never designed to support.
A 2024 study led by Professor Pak-Lok Poon — involving researchers from Central Queensland University, Swinburne University of Technology, City University of Hong Kong, and The Royal Victorian Eye and Ear Hospital — found that 94% of spreadsheets used in business decision-making contain errors. The study, published in Frontiers of Computer Science, examined 35 years of research on spreadsheet quality. Financial consequences identified include loss of revenue, profit, and assets, mispricing, poor decision-making, and in some cases financial failure.
The errors identified are not primarily the result of carelessness. They are structural. Spreadsheets are built manually, shared between people, updated without version control, and used to reconcile data extracted from systems that were not designed to integrate with each other. At a certain scale of organisational complexity, the conditions for error become unavoidable.
Spreadsheet Dependency: The Numbers at a Glance
The following statistics, drawn from industry research published between 2022 and 2025, illustrate the scale of spreadsheet reliance across global business environments and the measurable consequences of that reliance.
Statistic | Source | Year |
67% of global businesses use spreadsheet software daily | 2025 | |
58% of organisations describe spreadsheets as essential for financial planning | 2025 | |
54% of organisations use spreadsheets for reporting and analytics | 2025 | |
49% of organisations use only spreadsheets and basic reporting tools for analytics | 2022 | |
Nearly half of large companies still use spreadsheets to manage ESG and sustainability data | 2024 | |
94% of spreadsheets used in business decision-making contain errors | 2024 | |
Manual data entry error rates range from 1% to 5%, with each error costing $50–$150 to correct | 2024 | |
140 public companies issued financial restatements in the first 10 months of 2024 — a nine-year high | 2024 | |
25%+ of data and analytics professionals cite poor data quality as a barrier to data literacy, with estimated losses exceeding $5M annually | 2023 | |
Poor data quality costs organisations up to 25% of annual revenue | 2024 |
The Scale of Spreadsheet Dependency in Practice
The figures above become more instructive when examined in context. The Deloitte Analytics Advantage Survey finding that 49% of organisations rely solely on spreadsheets and basic tools means roughly half of businesses are operating without any dedicated analytics infrastructure beyond what can be constructed manually. That is a significant proportion of organisations making decisions from data that has not been systematically validated.
In compliance and regulatory contexts, the dependency is equally pronounced. A KPMG survey found that nearly half of large companies still use spreadsheets to manage ESG and sustainability data — despite the increasing rigour of audit and reporting obligations in this area.
The financial consequences are measurable and documented. In the first ten months of 2024, 140 public companies notified investors that their previous financial statements were unreliable and required restatement — a nine-year high, according to Ideagen Audit Analytics. While not all restatements are attributable to spreadsheet error, the correlation between manual reporting processes and financial statement accuracy is well established in the research literature.
Forrester's Data Culture and Literacy Survey found that over 25% of data and analytics professionals cite poor data quality as a barrier to data literacy within their organisation, with estimated annual losses exceeding five million dollars. Seven percent report losses of twenty-five million dollars or more.
What Self-Service Analytics Means in Practice
The term self-service analytics is used in a range of contexts, not all of them consistent. In the context of modern data platforms, it refers specifically to the ability of business users — in finance, operations, compliance, HR, and executive leadership — to access, explore, and act on current, accurate data without requiring IT intervention or manual report production.
The practical distinction from a spreadsheet-based environment is significant. In a self-service analytics environment:
A finance manager accesses current figures directly from a governed dashboard rather than waiting for a report to be manually compiled and distributed.
A compliance officer generates audit-ready outputs on demand from a single, traceable data source rather than reconciling extracts from multiple systems.
An executive reviews performance against operational targets in near real-time rather than at the end of a manual reporting cycle.
The tools enabling this are increasingly accessible. Microsoft Power BI, Tableau, and Streamlit are widely used visualisation and exploration platforms that do not require technical expertise to operate at a user level. Azure Databricks provides the underlying data platform on which those tools run. The gap between spreadsheet-based reporting and self-service analytics is, in most mid-sized organisations, less a technology gap than a data foundation and governance gap.
The Dependency Self-Service Analytics Creates
Implementing a self-service analytics capability introduces a dependency that is not always visible at the point of purchase or implementation: the data feeding the dashboards must be accurate, current, and consistently structured. A Power BI dashboard connected to unreliable source data does not reduce reporting risk — it changes where the risk manifests and makes it harder to detect.
This dependency resolves into three requirements:
Reliable integrations. Data entering an analytics platform from source systems — HR platforms, finance systems, CRM tools, industry-specific applications — must come through integrations that are actively maintained. SaaS platforms release updates continuously. Research estimates manual data entry error rates of one to five percent depending on complexity, with each error costing between fifty and one hundred and fifty dollars to correct. Integrations that are built and left unmonitored will degrade as APIs change, authentication models evolve, and platform behaviours shift — often without visible failure until data is already incorrect. For organisations planning AI or advanced analytics initiatives, this dependency becomes more consequential — unreliable pipelines disqualify data before it reaches a model. See why most organisations are not ready for AI.
Governed data pipelines. Raw data from source systems must be validated, transformed, and structured before it reaches a business user. The Medallion architecture — in which data moves through Bronze, Silver, and Gold layers with quality and consistency checks at each stage — is the established approach within modern data platforms for enforcing this structure. Without it, dashboards present unvalidated data with the visual authority of a polished interface, which in regulated industries creates compliance exposure as well as operational risk.
Defined data ownership. In a governed modern data platform, data lineage — the ability to trace a figure from its presentation in a dashboard back to its source system through every transformation — is documented and auditable. In a spreadsheet-based environment, that lineage rarely exists, leaving organisations vulnerable to operational inefficiencies and compliance risks that are difficult to detect until an audit or failure event makes them visible.
Adoption Patterns Across Target Industries
In Education, the operational reporting environment typically involves long-lived platforms, seasonal data loads, and strict obligations around student administration, payroll, and funding compliance. The transition from spreadsheet-based to platform-based reporting reduces the manual effort of period-end reconciliation and improves the traceability of data used in statutory returns.
In State and Local Government, audit expectations and public accountability obligations create particular pressure around data governance and lineage. Self-service analytics in this context supports programme performance reporting and budget variance analysis, reducing dependence on centralised IT for routine report production while improving the auditability of outputs.
In Mining and Resources, operational data spans distributed sites, contractor workforces, and corporate functions. Consolidating this data into a governed platform — rather than managing it through site-level spreadsheets and manual corporate consolidation — addresses both reporting accuracy and the compliance requirements associated with safety and workforce management in the sector.
In Accounting and Professional Services, the shift to self-service analytics directly affects the quality and timeliness of client-facing insight. Firms that move from manually produced reports to governed, platform-based dashboards reduce reconciliation effort and improve the consistency of data presented to clients — a factor with direct implications for professional liability where financial data is involved.
The Ownership Gap That Persists After Implementation
The transition from spreadsheet-based reporting to self-service analytics is not a one-time implementation exercise. Modern data platforms require ongoing maintenance as source systems evolve, new data sets are onboarded, and governance standards must be applied to new requirements.
Research estimates that poor data quality costs the global economy over three trillion dollars annually, with businesses potentially losing up to 25% of revenue as a result. A significant proportion of this cost is not attributable to inadequate technology — it is attributable to the absence of sustained ownership of the data environment after initial implementation.
The traditional project-based consulting model addresses the build phase of a modern data platform. What it does not address is the ongoing maintenance of integrations, the governance of pipelines as volumes and schemas change, and the management of platform infrastructure as underlying technologies evolve. When a project team exits, the ownership of these responsibilities is typically absorbed informally by internal staff who were not resourced for the purpose — or it is left unaddressed until a failure event makes the gap visible.
The question of who owns the data environment after implementation is, in most mid-sized organisations, as consequential as the question of which technology to implement.
Summary
The research on spreadsheet reliability is consistent across decades of studies: the error rate in spreadsheets used for business decision-making is high, the financial consequences are measurable, and the structural conditions that produce errors do not improve as organisational complexity grows.
Self-service analytics, built on modern governed data platforms, addresses the reliability and accessibility limitations of spreadsheet-based reporting. Its effectiveness depends on maintaining the integrations, pipelines, and governance structures that make the underlying data trustworthy — and on ensuring that ownership of those elements is clearly assigned and actively fulfilled over time.
The technology required to make this transition is available and, for mid-sized organisations, increasingly accessible. Whether that technology produces the outcomes it promises depends on the state of the data foundation it sits on.
Cypher Agency is a boutique data and integration engineering firm helping mid-sized businesses build reliable, governed data and integration environments — without the cost of building an internal team.
References
Poon, P-L. et al. (2024). Spreadsheet quality assurance: a literature review. Frontiers of Computer Science. https://phys.org/news/2024-08-business-spreadsheets-critical-errors.html
Global Growth Insights. (2025). Spreadsheet Software Market Size & Share Trends. https://www.globalgrowthinsights.com/market-reports/spreadsheet-software-119284
Global Growth Insights. (2025). Spreadsheet Software Market Report. https://www.globalgrowthinsights.com/market-reports/spreadsheet-software-118110
Deloitte. (2022). Analytics Advantage Survey. https://www.deloitte.com/content/dam/assets-shared/legacy/docs/analysis/2022/dttl-analytics-advantage-infographic.pdf
KPMG. (2024). ESG Data Management Survey, via ESG Today. https://www.esgtoday.com/nearly-half-of-companies-still-using-spreadsheets-to-manage-esg-data-kpmg-survey/
Ideagen Audit Analytics. (2024). Financial Restatement Data, via Limelight. https://www.golimelight.com/blog/how-accounting-errors-are-increasing
Forrester Research. (2023). Data Culture and Literacy Survey, via Revefi. https://www.revefi.com/blog/business-operations-poor-data-quality-cost
Conexiom / Backwell Tech Corp. (2024). Manual Data Entry Error Rate Research, via Upward Technology. https://www.upward-technology.com/the-spreadsheet-dilemma/
Comments